Theo Schlossnagle is very fond of pointing out that in operations, you can never succeed in fulfilling expectations.
"Operations crews are responsible for the impossible: it must be up and functioning all the time. This is an expectation that one can never exceed." (Instrumentation and observability)
So, this article is about a time when things went wrong. It's not about an emergency situation where services were down, but more a subtle issue that almost went unnoticed. We will review how the issue was detected, how it was fixed—and most importantly—how a root cause was determined.
This issue affected a production website for one of OmniTI's clients. They had three web servers, all connected through a front-end load balancer appliance. (There were database servers as well, but they aren't relevant for this story.) Like any good (or even half decent) load balancer, it checks often (every few seconds) to ensure that that the web servers are up and serving web pages. If the web server appears down or isn't responding, then the load balancer stops directing traffic to that web server. This gives you a measure of redundancy in addition to load balancing, if you have enough web servers to cover the incoming requests even with some out of commission.
The problem was uncovered by chance when working on the load balancer. We spotted that the load balancer was misdetecting that a server was down, taking it out of service, and a few seconds later on the next check, it would bring the server back into the rotation. This cycle repeated over and over, with each of the web servers being taken out of service for a short period. During this time, the site was still available: at least one of the servers was continually in service. In addition, our monitoring showed that everything appeared to be OK, both the external checks against the main website, and the checks against the individual web servers.
Having discovered the issue, the troubleshooting began. One of the first things to look at with any issue are log files. When set up properly, logs go a long way in telling you what is going on; the hard part is figuring out which logs have the information you need.
The first log file we checked was the load balancer log. It had entries that looked like the following, that corresponded with the service failures:
Monitor_http302_of_foowidgets-www1:http(192.168.1.51:80): DOWN; Last
response: Failure - TCP syn sent bad ack received with fin
So, according to the load balancer, the reason for the failure is 'TCP syn sent bad ack received with fin'. The error message is highly technical and not particularly helpful.
Here's a quick (and incomplete) overview of TCP to explain what that means:
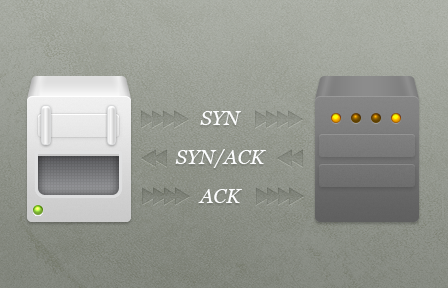
When you open a connection, packets are sent back and forth with various flags set - the relevant flags here are SYN, ACK, and FIN. The opening sequence goes something like:
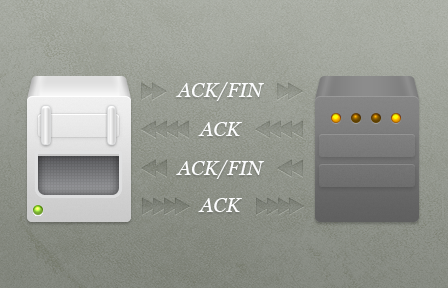
And to close the connection:
The explanation for the "syn sent bad ack received with fin" error is likely to be:
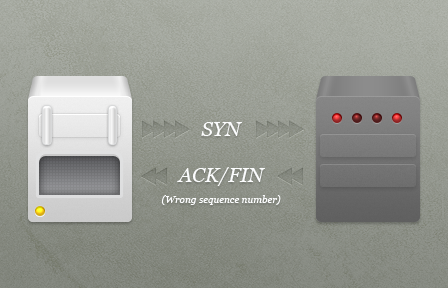
At this point, the load balancer gets very upset and sulks in the corner (well, it prints the weird log message). I'm guessing that the bad ACK/FIN is probably from a previous connection, but at a high level: "Something weird is going on with networking".
When things are screwy with the networking, you need to look in detail at what is going on across the network and try to work out what's going wrong. The tools to do this are tcpdump and wireshark.
The load balancer is an appliance with its own custom software, but underneath it's just Unix. You can get a shell and run tcpdump to see what is going across the network. Wireshark is essentially a graphical version of tcpdump and is used here to analyze the network traffic.
I grabbed all of the traffic, opened it with wireshark, and limited the view to just the traffic going to the web servers exhibiting the problem. The wireshark filter is:
ip.addr == 192.168.1.254 &&
    ( ip.addr == 192.168.1.51 ||
      ip.addr == 192.168.1.52 ||
      ip.addr == 192.168.1.53 ) &&
    tcp.port = 80
The 192.168.1.254 IP is the load balancer, and 51-53 are the web servers.
The following is the output of two complete HTTP transactions on the monitors:
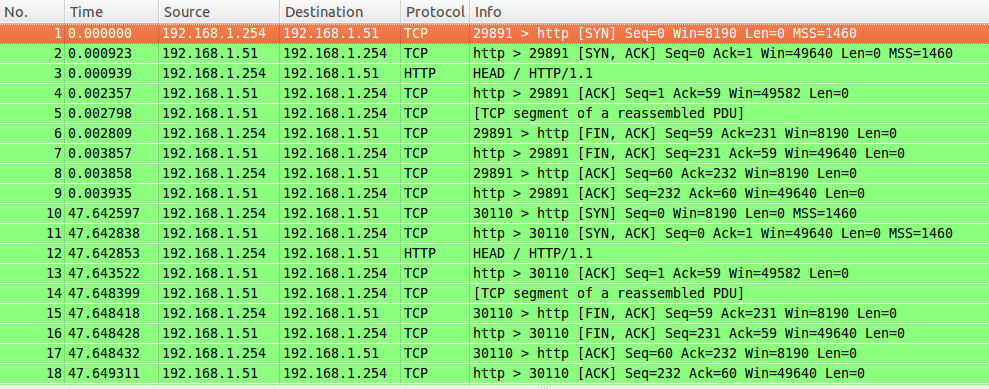
There is no SYN sent with bad FIN/ACK; everything is green and looks just fine. So I rechecked the load balancer console, and it showed eight checks went out in the same time frame as the tcpdump. However, I saw only two in the previous tcpdump. Something wasn't right.
At the same time that this was going on, I was in touch with support for the load balancer vendor. They were very helpful (in the sense that they did everything they could without actually getting to the bottom of the problem), asking for several tcpdump traces, and even escalating to their engineering team. At this point we were convinced that the monitor that checks whether the server is down was broken, and reporting the server down, when it wasn't. Unfortunately, none of this shed any light on the underlying issue.
We had also checked the usual culprits:
- Checked that the backend servers were up
- Checked the physical cables. Other services were transiting the same physical path and they were fine.
- Ran tcpdump on the server's network interface that linked it to the load balancer, this showed the same thing as the dump from the load balancer.
- Checked the configuration of the monitor on the load balancer. Other services were using an identical configuration without issues.
Then, the crucial discovery:
- Not enough checks were being sent out (we spotted this before)
- The support representative casually mentioned seeing traffic going out of the load balancer through another MIP. He thought maybe some of the checks were going out of this other IP.
- None of us realized the significance of this at the time, and a couple of days went by—with support convinced there was an issue with the backend servers, and me running as many checks as I could to try to prove/disprove that the backend servers were an issue.
Here's a bit of explanation of what was going on:
The load balancer has 3 different types of IPs (simplifying a little):
- VIP - Virtual IP
- MIP - Mapped IP
- SNIP - Subnet IP
A VIP is an IP upon which you run your virtual servers. These are what client traffic hits.
A MIP is described as: "You use MIP addresses to connect to the backend servers." (from the vendor's knowledge base).
A SNIP is described as: ". . .an IP address that enables you to access a load balancer appliance from an external host that exists on another subnet." (from the vendor's knowledge base).
From the explanation above, it makes sense that you would configure a MIP to connect to the backend server. This is what we did when originally setting up the load balancer, and it turned out to be completely the wrong thing to do, although it did work for a while.
Some more explanation - Multihomed networking 101:
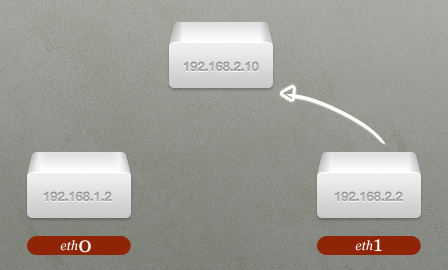
- A server has two interfaces on two different subnets - 192.168.1.0/24 and 192.168.2.0/24.
- The server wants to send a packet out to 192.168.2.10. To do this, it looks up the address in the routing table and sees that it should send the packet out of the second interface.
- Also, the source IP of the packet sent out is the IP address that is associated with the second interface. For example: 192.168.2.2.
If you're familiar with networking, the above explanation should sound pretty straightforward. The problem is, the MIPs on the load balancer don't work like that. Things work the same for steps 1 and 2 above, but instead of matching the source IP address of the packet to the interface it's sending out on, it just picks one IP from the list of available IP addresses:
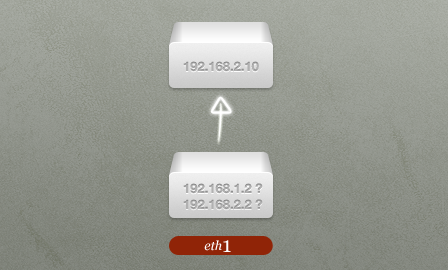
Now, to be fair to the load balancer vendor, this is the correct behavior for MIPs when you read more into what they are for. They're 'last resort' source IPs when nothing else is suitable, (i.e. you don't have a matching IP on the same subnet). Because it's a 'last resort' IP, it just picks one.
We had 3 different MIPs at the time, one for an external network, one for the client network, and one for our internal network. This meant that fully two-thirds of traffic from the load balancer was getting sent out from the wrong IP:
- 192.168.1.254
- 192.168.2.254 - wrong network
- 1.2.3.254 - external network
Believe it or not, this shouldn't have mattered, and in fact didn't matter for most of our services. The default route of the server was through the load balancer - it had to be to answer client requests, which came from external IP addresses.
However, by a horrible quirk of routing, on the backend web servers, 192.168.2.X was set to go out on a different interface, and traffic wasn't getting sent back to the load balancer, meaning 1 in 3 monitor responses weren't getting sent back.
This also meant that each web server was not serving traffic 33 percent of the time and we were effectively running off of two web servers. If the right combination of monitors went off, all three servers could be taken out of the rotation.
The temporary fix was to make sure that 192.168.2.0/24 went out via the load balancer. A single command fix gave a 50 percent capacity boost. The fix was just in the nick of time, too — just four days after I made the fix, the site was featured on the front page of msn.com and we got the biggest traffic spike ever in its history.
This fix was only temporary, as we were still having checks originate from the wrong IP, and the real fix was to use the Subnet IPs which, as their name suggests, actually respect subnetting.
As with all complex systems, the problem was caused by a number of different issues combined:
- The documentation was misleading, which lead to the wrong IP type being configured on the load balancer.
- Multiple networks on the backend server combined with virtualization, which led to incorrect routing when combined with the check originating from the wrong address.
- Fault tolerant systems combined with the tiny outage duration for individual web servers masking the issue and greatly increasing time to detection.
Experience is always earned the hard way. Having things go wrong leads to a deeper understanding of how complex systems work, as shown in the example above—at the end, we had a much better grasp of the inner workings of the system than before. Gaining this understanding is essential to prepare you for new technologies and production troubleshooting.
When a technology "just works," it is pretty much guaranteed that you don't know "how" it works (at least deeply). The real challenge is building architectures where usual, run-of-the-mill mistakes cause no disruption of service. That is an art and the artwork is an invaluable resource to the organization: it provides a canvas for learning and gaining hard-won experience.