At OmniTI we are known for our work on solving problems with scalability in mind; most of us love what we do because we get the opportunity to play around with different technologies and make cool and scalable solutions for problems.
Recently, I had an interesting problem to solve myself that I turned into a “big data” problem for curiosity reason. For the problem at hand, I had to analyze two or three days of PostgreSQL logs to make decisions about different issues, like finding out from where clients connect, what they do and how long sessions last.
To start working, I logged onto the server and noticed that each day’s worth of logs was 500Mb, so I had to analyze about 1.5GB of logs. With the help of awk I did the job, but as a geek, I wanted to take the problem to the next level: What would I do if I had to analyze logs from last month, and what would happen if I had more than one server? How could I scale the solution? A month would have 45Gb worth of logs, and from 10 servers it would be something like 450Gb: more than 5TB of logs over the course of one year. That’s a lot of data to analyze with sed and awk, it would take ages just to answer a simple question, and I would have to store that data somewhere. It was now obvious that I was venturing into big data territory.
Big Data
At Surge 2013, I heard the term, “Big Data” a number of times, and got the best description of it. Someone said that there is no real definition of big data and that it’s defined by the individual: it can be anything from images to documents (or as in my case, it can be log files), but no matter what the data might look like it all shares a common attribute. When the data-set is so large and complex, that it becomes difficult to process using a single database tool or a traditional data processing application. Quite recently, I implemented PostgreSQL backups into Hadoop with the use of OmniPITR, so I thought it a good opportunity to use that knowledge to solve my current problem. I got chance to work with Hadoop earlier, so I decided to solve my problem using HDFS and it’s map-reduce functionality to achieve parallelism and get results in reasonable time.
Why Hadoop?
Being an engineer, I divided the bigger problem of processing a large volume of data into three, smaller tasks.
I had to come up with a solution to answer following questions:
- Where should I store the data?
- How can I get answers in a reasonable time frame?
- Would the solution be able to scale in proportion to data-set growth in future?
Hadoop answers all of these questions. If my problem wasn’t theoretical, I would simply go to my colleagues and ask them to install Hadoop, sparing me as much disk space as possible. So there’s the solution to questions 1 and 3 (and let’s not forget: that’s with no additional software costs for my company!) I would create a big Hadoop cluster with my colleagues’ corporate PCs to run map/reduce functions. This solution can be scaled up with zero - little cost, and I could run almost all of the queries I wanted on a big data-set. Now I had a solution, but I had to find a use case to make sure that this would work as I imagined.
The Case!
Again, with scalability in mind, I wanted to answer the following question. I have three fictional data centers across the globe: one in Europe, another in the United States, and another in Asia, and I want to know which one serves whom and how my connections distribute. A relatively simple question on a difficult data-set, but if I was able to answer that, then no matter how many servers were used or how big the logs were, I would be able to answer anything.
Putting Everything Together
With a real use-case and a possible solution in mind, I had to make a checklist of all the different things I would need, like test data, to make a meaningful comparison between one and two Hadoop node runtimes. I would need machines--two Debian VMs running Hadoop seemed like a good starting point--and last, but not least, I would need a MapReduce function. I wrote a log generator to create 1GB worth of data, I setup the VMs and decided to use Hadoop streaming so I could avoid writing code in Java. I chose to use Python and coded two functions that would return something like:
-
The aggregation would show me all my servers, who each one serves and the number of connections... perfect!
I got first timing results with Hadoop, it was close to what a simple shell script would give me. I scaled it up to the second node, and I got 25% less time. Not bad, but not great either. Then, I decided to use all possible machines that I could put my hands on to see what would happen. Two laptops and two desktops--one of them being remote. With the increased number worker threads, I got a result in one-third of the time! I had the output data answering my first question in a scalable way and with $0 cost.
Now what?
Ok, I have aggregated data, but what did it mean? How could that give me answers to real business questions, like: where are these clients located? which country or even city uses my databases the most? which server do I have to upgrade first and monitor closely? where should I put my next server?
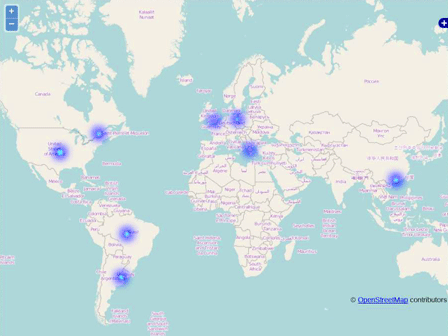
At this point the result of my map/reduce functions was structured data that would fit into a database nicely. Even if I had one connection from each IP in the world (approximately 4.3 billion addresses), a PostgreSQL database would handle them without any problem. I would be able to answer every possible query and I would be able to do something extraordinary: code Geo-functions that would tell me where each IP came from. I used plsh to create some functions to call a whois service and return the country, the region, and most importantly, the longitude and latitude of each IP. The possibilities are infinite! I could pinpoint groups of IPs and make usage patterns, like Heat maps and other neat stuff. To take this project even further one last thing was missing, a good way to visualize my data. I had zero experience with Geo data -- and by zero I mean zero! I found that I could do what I wanted with google map’s API but Google has some strange licensing model that I didn’t understand so I decided to go with “Open Street Maps”. Again Open Street Maps is open source, like everything used so far. All I needed was some basic knowledge of Javascript to use their API in order to create heat maps. It took me some time, but later the same day I had pretty output with the answers I wanted:
Conclusion
If, as they say, information is gold, then open source is the alchemy of the 21st century: making gold out of iron.
What began as a simple question, turned out to become something more--some kind of “business usable solution.” No matter how much data, no matter how many clients or servers, no matter the origination of the logs, this “patchwork of projects” would give answers, it would scale and, as a result, it would answer real questions!
Appendix
Technologies used:
- PostgreSQL
- Hadoop
- Python
- Plsh
- SQL
- Shell scripting
- sed & awk
- Apache
- Javascript
- Open Street Map
Code Repository: