We recently came across a situation that plays out time and again in different organizations around monitoring, notification, and on-call planning. At OmniTI, we adhere pretty well to keeping a tidy working set of alert notifications. In most cases, when systems change (and being in web operations, the systems are always changing), we handle these changes with little to no debate. In this case, however, for some reason, it sparked a discussion and after seeing certain language and phrases used (and maybe misused) made it feel like a good time to make sure we were following our own guidelines around alert design.
The incident itself was nothing exciting. An alert that monitors a critical business process had fired a few times in rapid enough succession, which raised warning flags with our SRE team. As part of our regular alert review, we performed a quick investigation to see if we could learn more about what was going on with this alert. The first step was to look at the current status of the process (everything was fine) and then to look at the error conditions, including what they were, and how long they were in an error state.
In this particular case, the alerts were not a result of the system reporting a failure, but because the check itself returned a null value. Using null alerts on specific checks helps to alert the team that status is unavailable and could mean an error condition that needs investigation. In all of the recent cases, this alert cleared itself (we eventually received a "status ok" message rather than the null) regardless of any involvement by our engineers. Furthermore, in cases when they did investigate, they saw nothing wrong. This obviously raises red flags from an alert management perspective.
It is important to note that, because we are working with complex distributed systems where you can have multiple points of potentially transient failure (ie. anything with networks + 3rd party services), we almost always buffer a null check to some degree. This means we expect to see the null condition reported multiple times before raising an alert. In this case, we checked the alert configuration and saw that it was set to alert only if the null response persisted for at least seven minutes. From the product owner's perspective, this is a pretty reasonable threshold… they are willing to go seven minutes with an unknown status for a critical business process; which could mean downtime for seven minutes before we even start reacting to it; in internet time that is pretty long. However, that wasn't the whole story.
We next looked to see how often we were doing metric collection and this is where we found a problem. It turned out the check in question was checking the status every four minutes, which meant that pretty much any time the system saw a null response, it would never issue a retry fast enough to avoid an alert. This spawned a series of new questions. Could we raise the threshold higher, to something over eight minutes, to ensure at least one retry? Or do we lower the interval for metric collection so that we ensure multiple attempts within our seven-minute window? These are good questions; people often don't think about the overhead of metric collection, and maybe we originally set this to collect at four minutes because asking the status is an expensive question; but not the kind of thing that prompts a blog post.
At one point during this investigation and the subsequent discussion, someone suggested a few times we would get the most business value by actually investigating the transient errors and fixing them. We often say that the point of technical work is to empower business, so a question on how best to serve the business is fair and deserves to be addressed. It's true that transient failures like this can be problematic, and might be a sign of an underlying problem. However it is important to understand that an alert review is not about creating more project work, it is about managing your operational response. When we say to focus your monitoring and alerting around driving business value, that doesn't mean prioritizing business operations over the business operators. We have talked to many a tech worker who tells us this is the kind of situation that their company could easily turn into an "emergency", where the SRE team might get sent down a rabbit hole that they hadn't planned on that day, disrupting who knows what other initiatives. And worse, expecting the team to just suffer through any additional false positives until the situation is fixed. Well, that isn't us; we believe that engineers have business value too.
In this case, we know that from a business perspective:
- 1. The business process is not failing
- 2. The transient null metrics are resolving themselves with no intervention
- 3. The frequency of nulls may be on the rise, but we haven't quantified how bad it is yet
- 4. Waking people up in the middle of the night for something that isn't causing any harm to the business causes harm to our people, which causes harm to the business.
Given the above, we decided the best way to manage the alert was to shorten the interval for metric collection to two minutes (meaning we need three null reports to trigger an alert). We were also able to look at the service history and see that while these alerts have lowered service availability in May, we were still within the boundaries of our service budgets, and overall the system is performing on par with historical trends. Luckily this was pretty easy to show to the folks with business hats since Circonus can auto-generate service uptime reports. (See below) Beyond that, we want to quantify the scope of the null metrics a bit more before deciding when and with what effort to go about troubleshooting and/or repairing that situation. All in all a ten-minute conversation that made for a good reminder that managing alerts is never a one and done type project, but requires regular review on the technical side, and reinforcement on the cultural side.
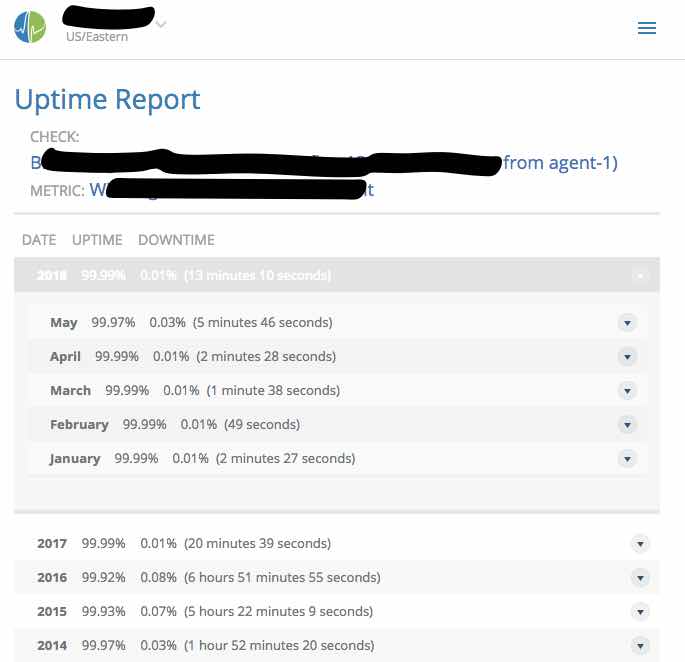 Figure 1: Circonus Uptime Report